# Data configuration example
Select the component
To select a component, first check the component interface description of data TAB. 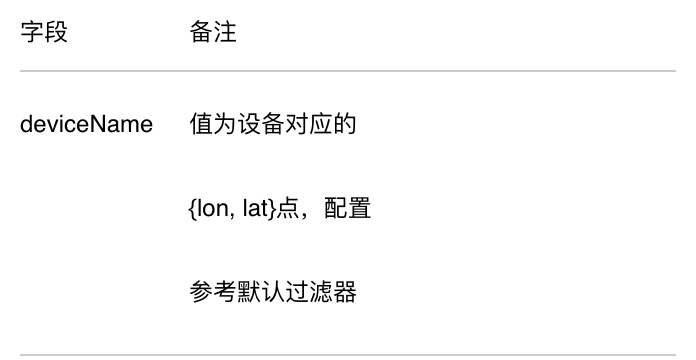
Let’s take base map component for example. The component requires data to be composed of data points of deviceName:{lon:'',lat:''}. According to the OneNET View 2.0 system, the data transferred to the component must be an array of objects, so the final data format transferred to the component should be
[
  {
    "dev1": {
      "lon": 116.404,
      "lat": 39.915
    }
  },
  {
    "dev1": {
      "lon": 116.404,
      "lat": 39.815
    }
  }
  ...
]
Viewing of initial private filter
If the interface field description cannot clearly express the data format acceptable to the component, when the component is added to the canvas in its initial state, there will be an initial private filter. This initial filter provides a sample of data format acceptable to the component.
Selection of data source
To make the points in the map component be added or changed according to the dynamic data source, we must select the data source with map data point information in .
The filter is not applicable for the time being. First, check the data of the current data source.
[
  {
    "update_at": "3/28/2019 4:44:54 PM",
    "id": "map",
    "create_time": "11/5/2018 10:34:31 AM",
    "current_value": {
      "lon": "116.40530370152352",
      "lat": "39.90664650680615"
    },
    "at": "3/28/2019 4:44:54 PM",
    "value": {
      "lon": "116.40530370152352",
      "lat": "39.90664650680615"
    }
  },
  {
    "update_at": "3/28/2019 4:44:59 PM",
    "id": "map",
    "create_time": "11/5/2018 10:34:31 AM",
    "current_value": {
      "lon": "116.41210366734866",
      "lat": "39.90668046099908"
    },
    "at": "3/28/2019 4:44:59 PM",
    "value": {
      "lon": "116.41210366734866",
      "lat": "39.90668046099908"
    }
  },
  {
    "update_at": "3/28/2019 4:45:03 PM",
    "id": "map",
    "create_time": "11/5/2018 10:34:31 AM",
    "current_value": {
      "lon": "116.42254386324525",
      "lat": "39.90675495735355"
    },
    "at": "3/28/2019 4:45:03 PM",
    "value": {
      "lon": "116.42254386324525",
      "lat": "39.90675495735355"
    }
  }
]
Use of filter
It is found that the data format of the data source is not consistent with that of the underlying map component. Some processing with a data filter (which only supports es5 syntax) will be required.
// The final data should be an array.
var result = [];
var dataPoint = null;
//process the data points of the selected data source in cycle
for (var i = 0; i < data.length; i++) {
  // obtain the required data from the data points, and configure the key-value pairs to achieve the compliant data format.
  dataPoint = {
    dev1: {
      lon: data[i].value.lon,
      lat: data[i].value.lat,
    },
  };
  // Add the data points into the result
  result.push(dataPoint);
}
return result;
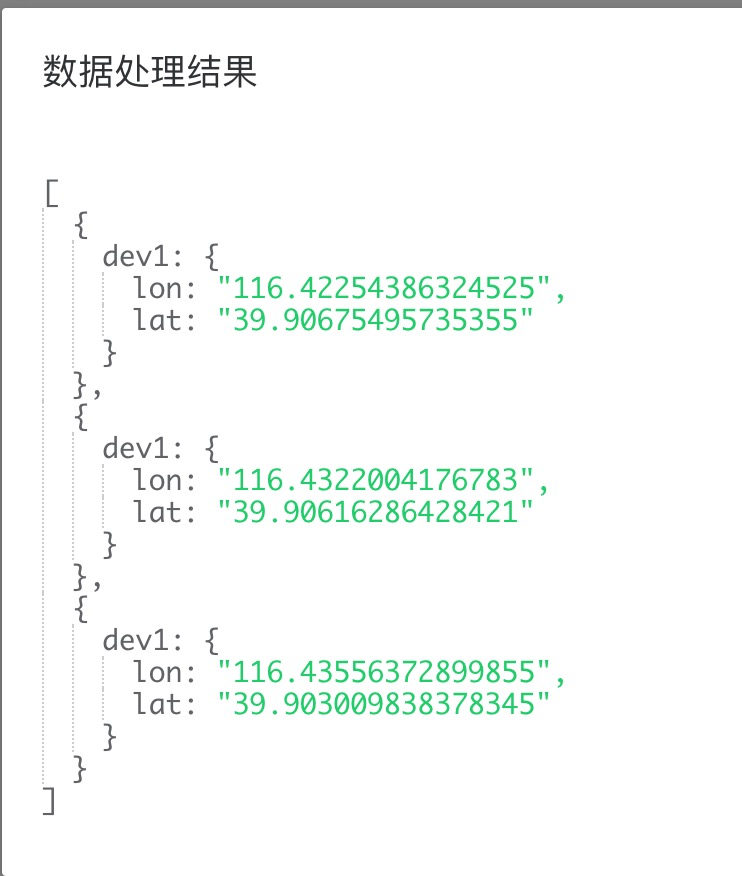
Write the above code in the filter code editing area, click “save”, and then select “enable the filter” to see the final data processing results. 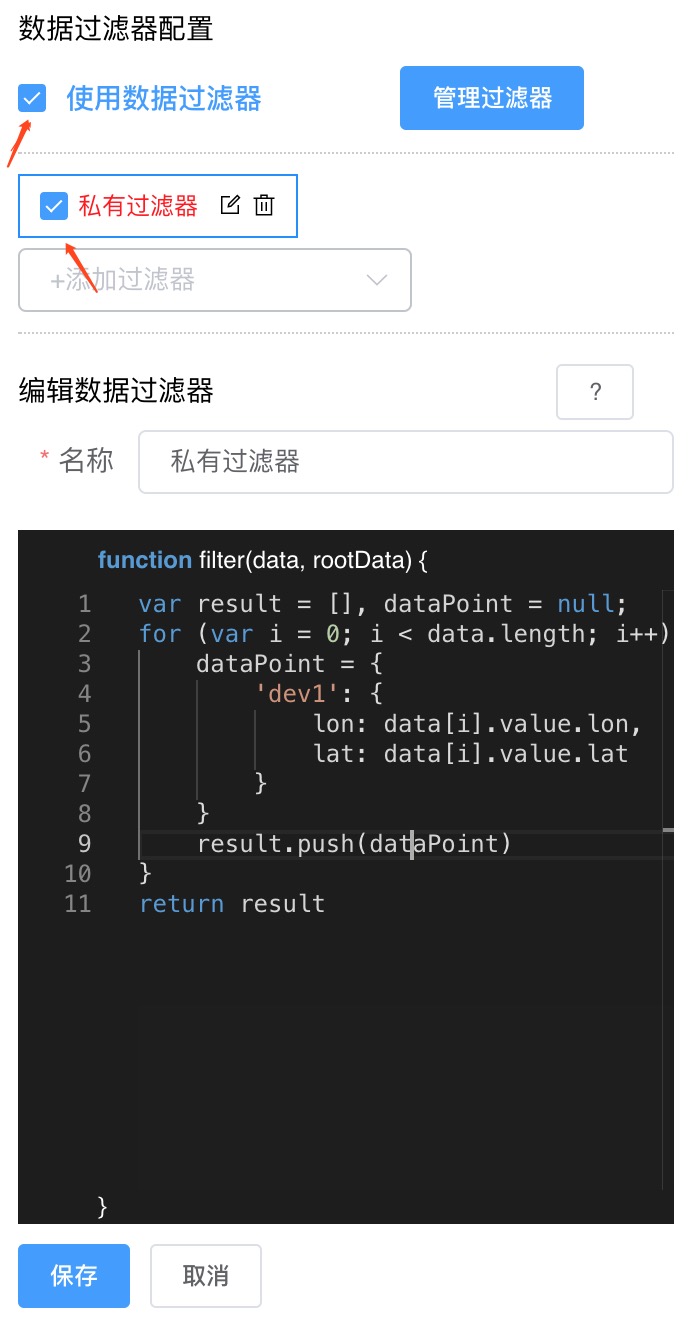
Thus the result meets the requirements of the component.